
The short answer
Editorial and Performance show the same result. Editorial is laid out as a briefing to read and forward, chapter by chapter. Performance is laid out as a dashboard for the person who opens the report every month to see what moved. Switch between them with the Editorial ↔ Performance control at the top of the report.
Same data, different jobs
Nothing in the Performance view is calculated that the Editorial view doesn't also hold. The difference is layout: Editorial is arranged for reading, Performance for scanning. Every number in both traces back to a saved AI answer.
| Editorial | Performance | |
|---|---|---|
| Best for | Clients, managers, anyone reading once | The team working on it every month |
| Layout | A story in chapters: Position, Customer demand, Competition, Plan, Progress, with Proof and method alongside | Tabs: Overview, Customer demand, Competition, Plan, Progress, Evidence |
| Numbers | Explained in sentences | KPIs with their likely range and the change since the last audit |
| Look | Light, like a document | Dark by default; Light or Match system available |
Using the Editorial view
- Position opens with whether you're recommended when customers ask without your name, and how the assistants describe you.
- Customer demand shows which customer questions you win and which you lose.
- Competition shows who is named instead, for which situations, and why they seem to win, with the answers attached.
- Plan lists what to fix first, each action tied to a page and to its evidence.
- Progress shows what moved since the last audit, and the weekly pulse in between.
- Proof and method opens the saved answers, the sources they cited and how the audit was run.
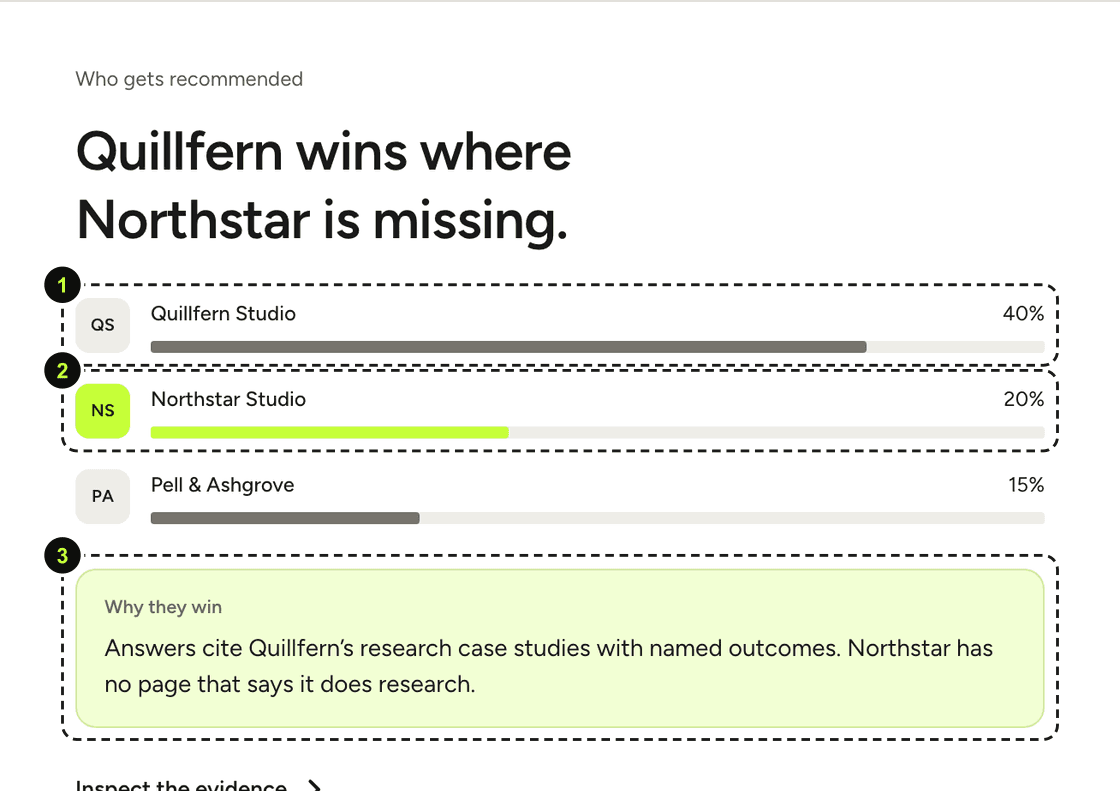
Agencies usually send this view to the client. Any paid plan can share a read-only link to the report. PDF export is included on Growth, Studio and Agency. On Studio and Agency the PDF and the client link can carry your logo with Scope's branding removed (white-label).
Using the Performance view
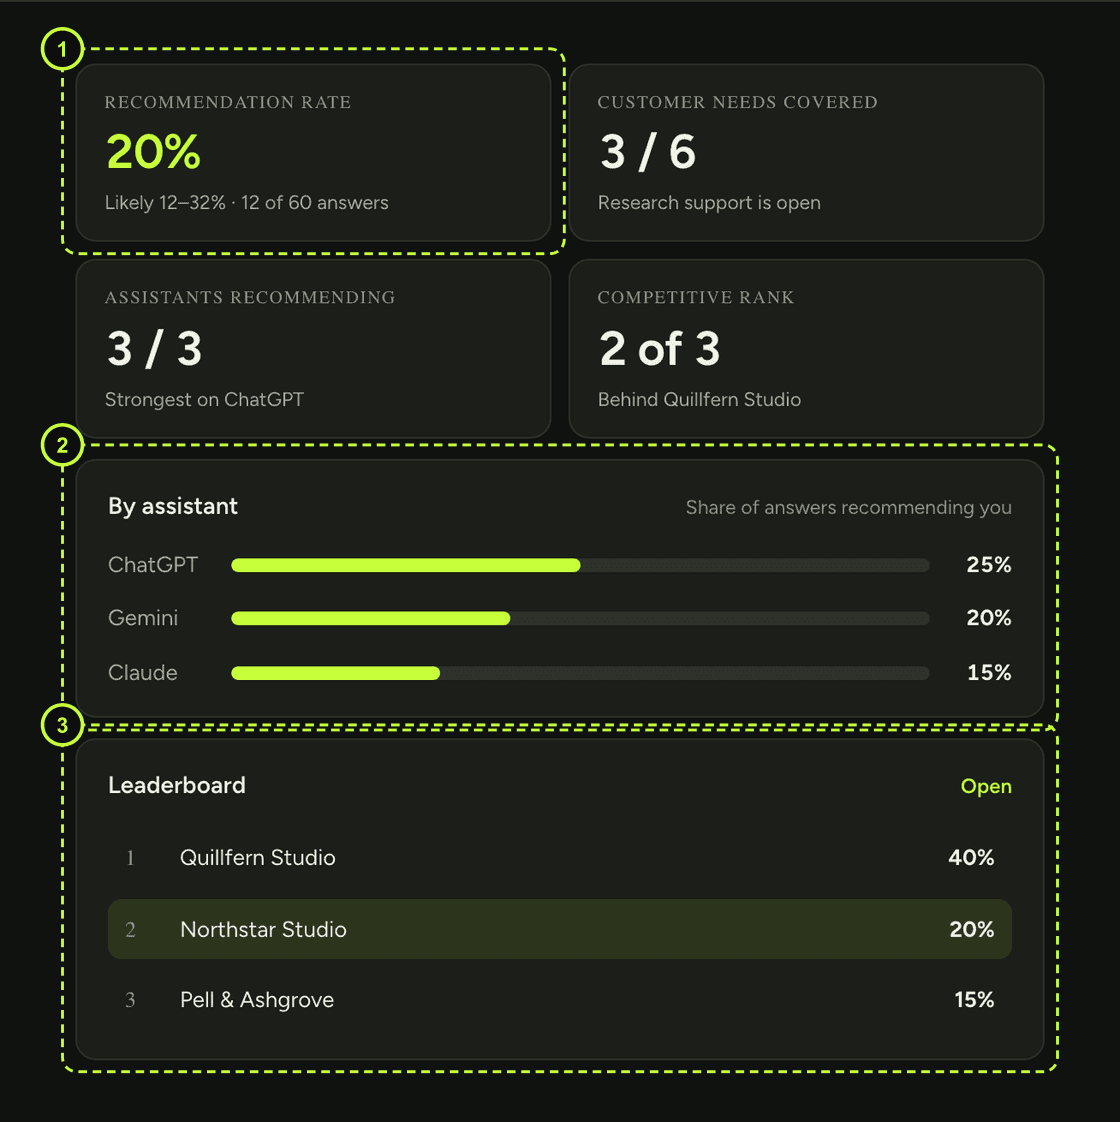
- Overview: headline rates, each with its likely range and the change since the last audit. A dash with "no change" means exactly that.
- Customer demand and Competition: which questions you win and lose, and who wins them.
- Plan and Progress: every action with its status. To do and In progress while you work on it; Checking while Scope re-asks the questions behind it; then Worked, No change, Declined (the position got worse) or Recheck (the evidence wasn't clear enough to say). Actions you set aside show as Parked or Dismissed.
- Evidence: the saved answers and citations behind every figure.
Why the numbers come with ranges
Rates are shown as whole percentages with a likely range, because a precise figure over a few dozen answers claims more certainty than the sample has. If two months' ranges overlap heavily, treat them as roughly the same. The methodology page explains how movement is judged.
What this can't tell you
- Both views show a dated sample of AI answers. Neither predicts what assistants will say next.
Sources
Primary sources first. Research papers are cited with their limits. Every source was re-opened on the date shown.
- 1Scope methodology
The InnerView · checked 25 September 2026
How Scope defines recommendation rate and visibility, compares audits, repeats questions and states its limits.
- 2Scope product facts and limitations
The InnerView · 24 September 2026 · checked 25 September 2026
Supported assistants, free check scope, monitoring rhythm and stated limitations, including that Google AI Overviews and Perplexity are not currently measured.
Get the next guide by email
Short emails on how ChatGPT, Gemini and Claude recommend businesses: the new piece, one real answer we saw, and one fix you can make. Unsubscribe any time.